Author: David Max MA DPhil (2020-11-12)
Results of a plant quadrat survey on a study plot
- Aim of this study
- Plant survey methods
- Results: abundance
- Results: associations
- Results: diversity indices
- References
Aim of this study
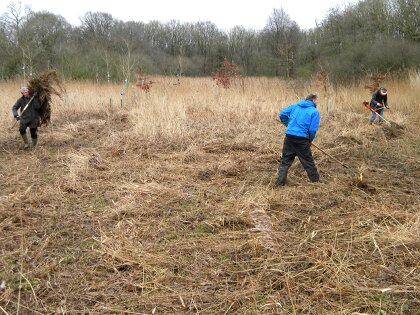
The purpose of the work described here is to test and monitor the success of habitat management within a fixed study zone on a damp meadow. The study zone will be cut and raked on a regular basis (at least annually) and the cuttings will be removed elsewhere.
 Removal of cuttings in this way should reduce nutrient levels and thus inhibit certain species such as nettle that thrive in conditions of high nutrient availability. Other species may thus be encouraged.
The study plot is a rectangular zone (40m x 15m) on the south-eastern part of the meadow.
This zone lies just north of a line of mature hybrid poplar trees, which cast shade over the zone in summer and also dump significant amounts of leaf-litter there in the autumn.
The leaf-fall into the zone is thought to be a major contributor to the nutrient loading in the patch. The patch may also have been enriched in the past by grazing livestock.
Plant survey methods
For the initial survey in May 2020, twenty-five samples were recorded at randomly-chosen locations within the study zone, using a square quadrat made of stiff wire (305 x 305 mm).
Quadrat locations were designed to cover the whole zone uniformly, but locally were thrown 'blind'.
The macrophytes present were recorded on a presence/absence basis (giving a score of 1 or 0).
The quadrat used was divided into 9 cells of equal size and each throw therefore generated 9 scores for each species encountered.
For each quadrat throw, an average score for each species was calculated by taking the mean of the cell scores. Thus each quadrat throw contributes a single frequency measurement for a particular species in the analysis.
Results: abundance
Eleven herbaceous plant species were recorded.
As the table below shows, four species predominate in the samples. Nettles Urtica dioica are the most abundant, occurring in 80% of samples.
The other main species present were common reed Phragmites communis, the cress Cardamine flexuosa, and goosegrass Galium aparine.
| code | species name | English | mean frequency |
|---|---|---|---|
| UD | Urtica dioica | nettle | 0.804 |
| PC | Phragmites communis | reed | 0.640 |
| CF | Cardamine flexuosa | cress | 0.467 |
| GA | Galium aparine | goosegrass | 0.462 |
| GT | Galeopsis tetrahit | hempnettle | 0.178 |
| PP | Poa pratensis | meadow grass | 0.169 |
| CaA | Calystegium arvensis | bindweed | 0.107 |
| AP | Aegopodium podagraria | ground elder | 0.071 |
| FU | Filipendula ulmaria | meadowsweet | 0.013 |
| CiA | Cirsium arvensis | creeping thistle | 0.009 |
| MD | Melandrium dioicum | red campion | 0.009 |
Oliver Rackham says that nettles and goosegrass are indicators of high phosphate levels resulting from human activity.
The study area may have been used in the past as grazing for farm animals and nitrogen levels are also likely to be high. However, phosphate is most likely to be the limiting factor (Jeffries & Mills 1990).
Management of the survey plot in the next few years will be aimed at reducing nutrient levels by cutting and raking.
Results: associations
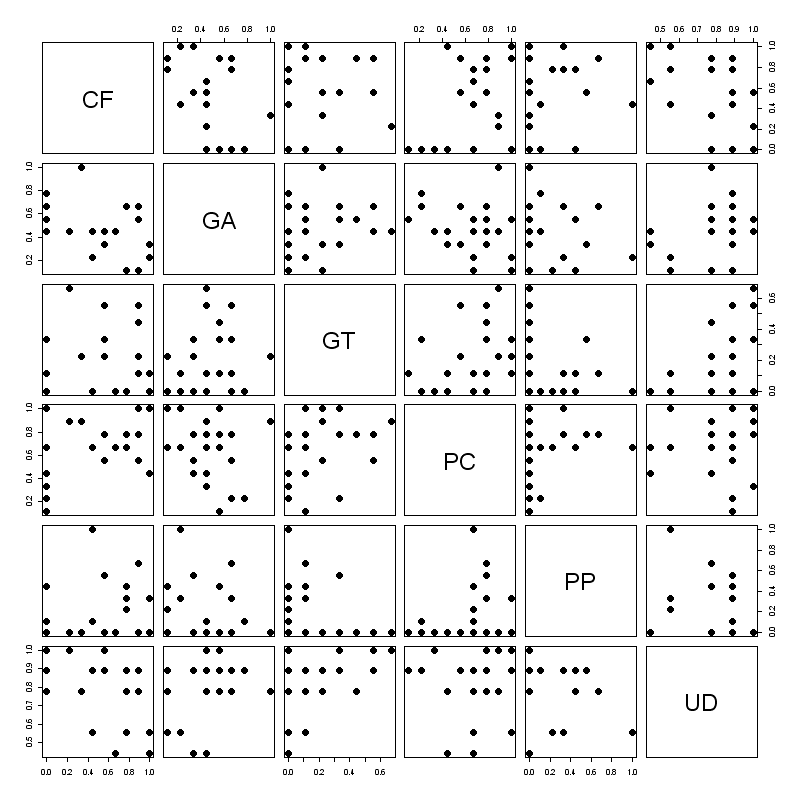
 A scatterplot matrix for the 6 most frequent species is shown.
Correlation tests show that:
- Galeopsis tetrahit is positively associated with nettle Urtica dioica (p = 0.011)
- The cress Cardamine flexuosa is negatively associated with Urtica dioica (p = 0.015)
- Cardamine flexuosa is positively associated with reed Phragmites communis (p = 0.014)
- Creeping thistle Cirsium arvensis is negatively associated with Phragmites communis (p = 0.025)
Results: diversity indices
Two commonly used diversity indices have been calculated for the survey results.
Simpson’s index (symbol D or λ) = 0.1824.
The Shannon index H’ = 1.876.
From these can computed values for the “effective number of species” as 5.48 and 6.53 respectively.
References
[1] Manly, B.F.J. 1994. Multivariate Statistical Methods. Chapman & Hall, London.
[2] Rackham, O. 1986. THE HISTORY OF THE COUNTRYSIDE. J.M.Dent, London.
