Author: David Max MA DPhil (2020-05-07)
Do climate change effects show up in local weather data?
- Mean temperatures for East Anglia
- Questions
- Answers
- Other observations
- Ecological effects
- R analysis files
- References
Mean temperatures for East Anglia
Climate change is a topic of huge importance today.
Trends in weather variables can be seen even at a local level, as shown here.
Data for the analysis presented below come from UKMO's website.
The data examined are the mean temperatures for the Met Office's East Anglia region, for each year.
Data are collected by the Met Office from lots of recording stations around the region (on an hourly basis) and then averaged to yield a single quantity for a specific year.
Questions
- Is there a detectable trend in temperature?
- Are the data serially correlated? Does the weather have a 'memory'?
- Is there any evidence of long-term cycles in temperature?
- Is there evidence for temperature being related to sunspot activity?
 Answers
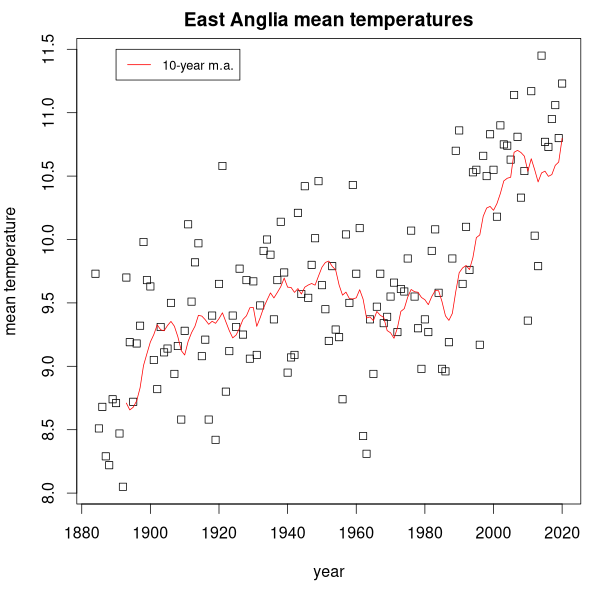
- There is a statistically significant trend, of approximately +0.011 degree (Celsius) per year. Over 10 years, this equates to a temperature rise in this region of about 0.1 degrees (and over 100 years, about 1.1 degrees).
- Mean temperatures are serially correlated. This indicates that temperature effectively has a 'memory', and the memory extends at least to the previous year, possibly the year before that.
- By contrast, there is no evidence of 'seasonality' in the data. The relevant data are single measurements for each year, so if significant seasonality was detected in this case, that might show a response to external long-term cycles (i.e. 'forcing factors'). However the R function stl() does not detect any seasonality.
- One of the best-established cycles is the Schwabe 11-year sunspot cycle [1]. Effects of the Schwabe cycle do not, however, show up the East Anglia temperature data.
Other observations
For the years covered by the series, the ten-year moving average of temperature starts at around 8.7C and reaches about 10.6C at the end.
[Note that several years in the 1880s were very cold indeed.]
Temperature rise has been linked to carbon dioxide release into the atmosphere by human activities.
The link was first predicted in the nineteenth century by various workers (Fourier, Tyndall, Pouillet, Arrhenius, et al) and is not a new idea.
Whereas atmospheric carbon dioxide levels have risen steadily over time, temperatures here in East Anglia have not risen smoothly in parallel.
The East Anglia plot might be interpreted in one of two ways:
- One view is that temperature was relatively stable from about 1900 to 1990, then turned sharply upwards.
- Alternatively, there is an underlying steady trend upwards, overridden by a cooling phase from around 1950 to 1990. After this interlude, the profile reverts to the underlying upwards trend. Some sources have suggested the cooling phase might be related to aerosols in the upper atmosphere. However, the overall effect of aerosols is complex and they can either increase or reduce the tendency of the atmosphere to absorb or reflect radiation [2]. So interpreting the plot is difficult.
The five warmest years in the series (out of 137 years) have occurred since 2005. The warmest so far was 2014.
The ten warmest years in the series all occurred after 1989.
Other weather variables
For comparison, also plotted are rainfall and sunshine for those years that data are available from the Met Office.
(The red line is the 10-year moving average, and the horizontal black line is the overall mean (i.e. average) level.)
No trend can be seen in the long rainfall series, whereas the shorter sunshine series roughly seems to mimic temperature changes.
Ecological effects
Various ecological indicators provide compelling evidence of climate change during the last few decades.
Here in the UK, spring is arriving progressively earlier. Plants flower earlier now than previously, and migrant birds arrive sooner.
Various insects seem to be in the process of colonising Britain.
An example is tree bumblebee Bombus hypnorum (a colony of which occupied a tit nestbox in 2017 at Hillside House).
Birds associated with more southerly parts of Europe are moving into English counties.
Examples are little egret (now well-established as a breeder), great white egret (bred recently at Holkham, a few kilometres from Raynham), spoonbill, black-winged stilt, Mediterranean gull, and so on.
The range extensions of these species might be partly explained as conservation successes, but climate change is clearly an additional, perhaps the main, factor.
R analysis files
Files for the analysis of the temperature data using R are available to download.
If you want to run this problem you will need already to have a working installation of R.
The files are available as either tar or zip archives, as below:
- R.MEANTEMP.tar (for Unix, Linux etc; tar is also available for Windows)
- R.MEANTEMP.zip (for Windows)
Click one of the links and your browser should ask you what you want to do with the selected archive file. First, save the file into a working directory of your choice.
The tar archive file can then be unpacked using the Linux/Unix shell command tar -xf R.MEANTEMP.tar.
On Windows the zip archive file can be unpacked by right clicking on the file and choosing "Extract all".
Start R, switch into the directory where the extracted files ended up, then run the script as...
source('R.MEANTEMP.R', echo=T)
